Logo

HPE is an enterprise software company providing cloud solutions using AI/ML, analytics for over 10+ industries with 250,000 + customers worldwide. I designed and shipped a workflow for HPE Ezmeral Unified Analytics which is an Industry’s first unified, modern, and hybrid analytics platform optimized for on-premises, edge, and cloud deployments.

Work image
Work image
Work image

A quick overview

HPE Ezmeral Unified Analytics is the industry’s first unified, modern, and hybrid analytics platform optimized for on-premises, edge, and cloud deployments. It is a one-stop open-source framework that enhances the collaboration between data engineers, data analysts, and data scientists. The target forecast for Big Data and Analytics is $215b growing at 13-15% CAG.

I worked end-to-end on the product and was the data engineer advocate. I collaborated with the product manager and product owner to prioritize the features for the BETA launch. That way I could define the product, balance business and customer needs, evangelize ideas, gain alignment and drive decision making. I was helping to take the product from 0 to 1

Role & Contribution

Product Discovery
Product Strategy
Interaction Design
Prototyping
Usability Testing

Collaboration

VP of Product
Product Managers
Designers
Engineers
Sales, Marketing & Legal

Tools

Figma

FigJam
Pendo

UserTesting

Notion

An identified business opportunity

To understand why the product should exist and how user experience can play a role, I asked the question ’why’. I collaborated with the product manager and product owner on this. I understood that Unified Analytics was established with a projection of a 20% increase in revenue for HPE, had an advantage over existing competitors, and utilized existing resources.

"Currently, data engineers undergo complicated workflows that are time consuming resulting in lower efficiency"


A challenging problem space...

As a product designer, I enjoyed working on the ambiguous and complex problem space presented to me. To deal with ambiguity, I believe in taking a step forward and iterating as necessary, as product design is an iterative process. I started my research by understanding the target persona, which was data engineers. I discovered that enterprises needed a seamless end-to-end platform that reduced friction for each data engineer persona to work with the tools of their choice. This was an opportunity that I identified.

Deep dive into customer insights

I conducted further research by interviewing 25+ customers. I discovered issues with performance time, user experience, and data dispersion among competitors in the market. To form a product strategy, I broke down larger chunks and scrutinized smaller tasks. Later, I looked at it holistically as an advocate for user experience.

Performance time

Competitors took 40% more time than the ideal performance time to ingest, manage and transform data.

User experience

Numerous errors and clicks

Unalignment between user's mental model and the application

Data dispersion

On an average customers use 5 or more different platforms with a rough split of 50-50 on-premises and cloud to store data according to EMA research
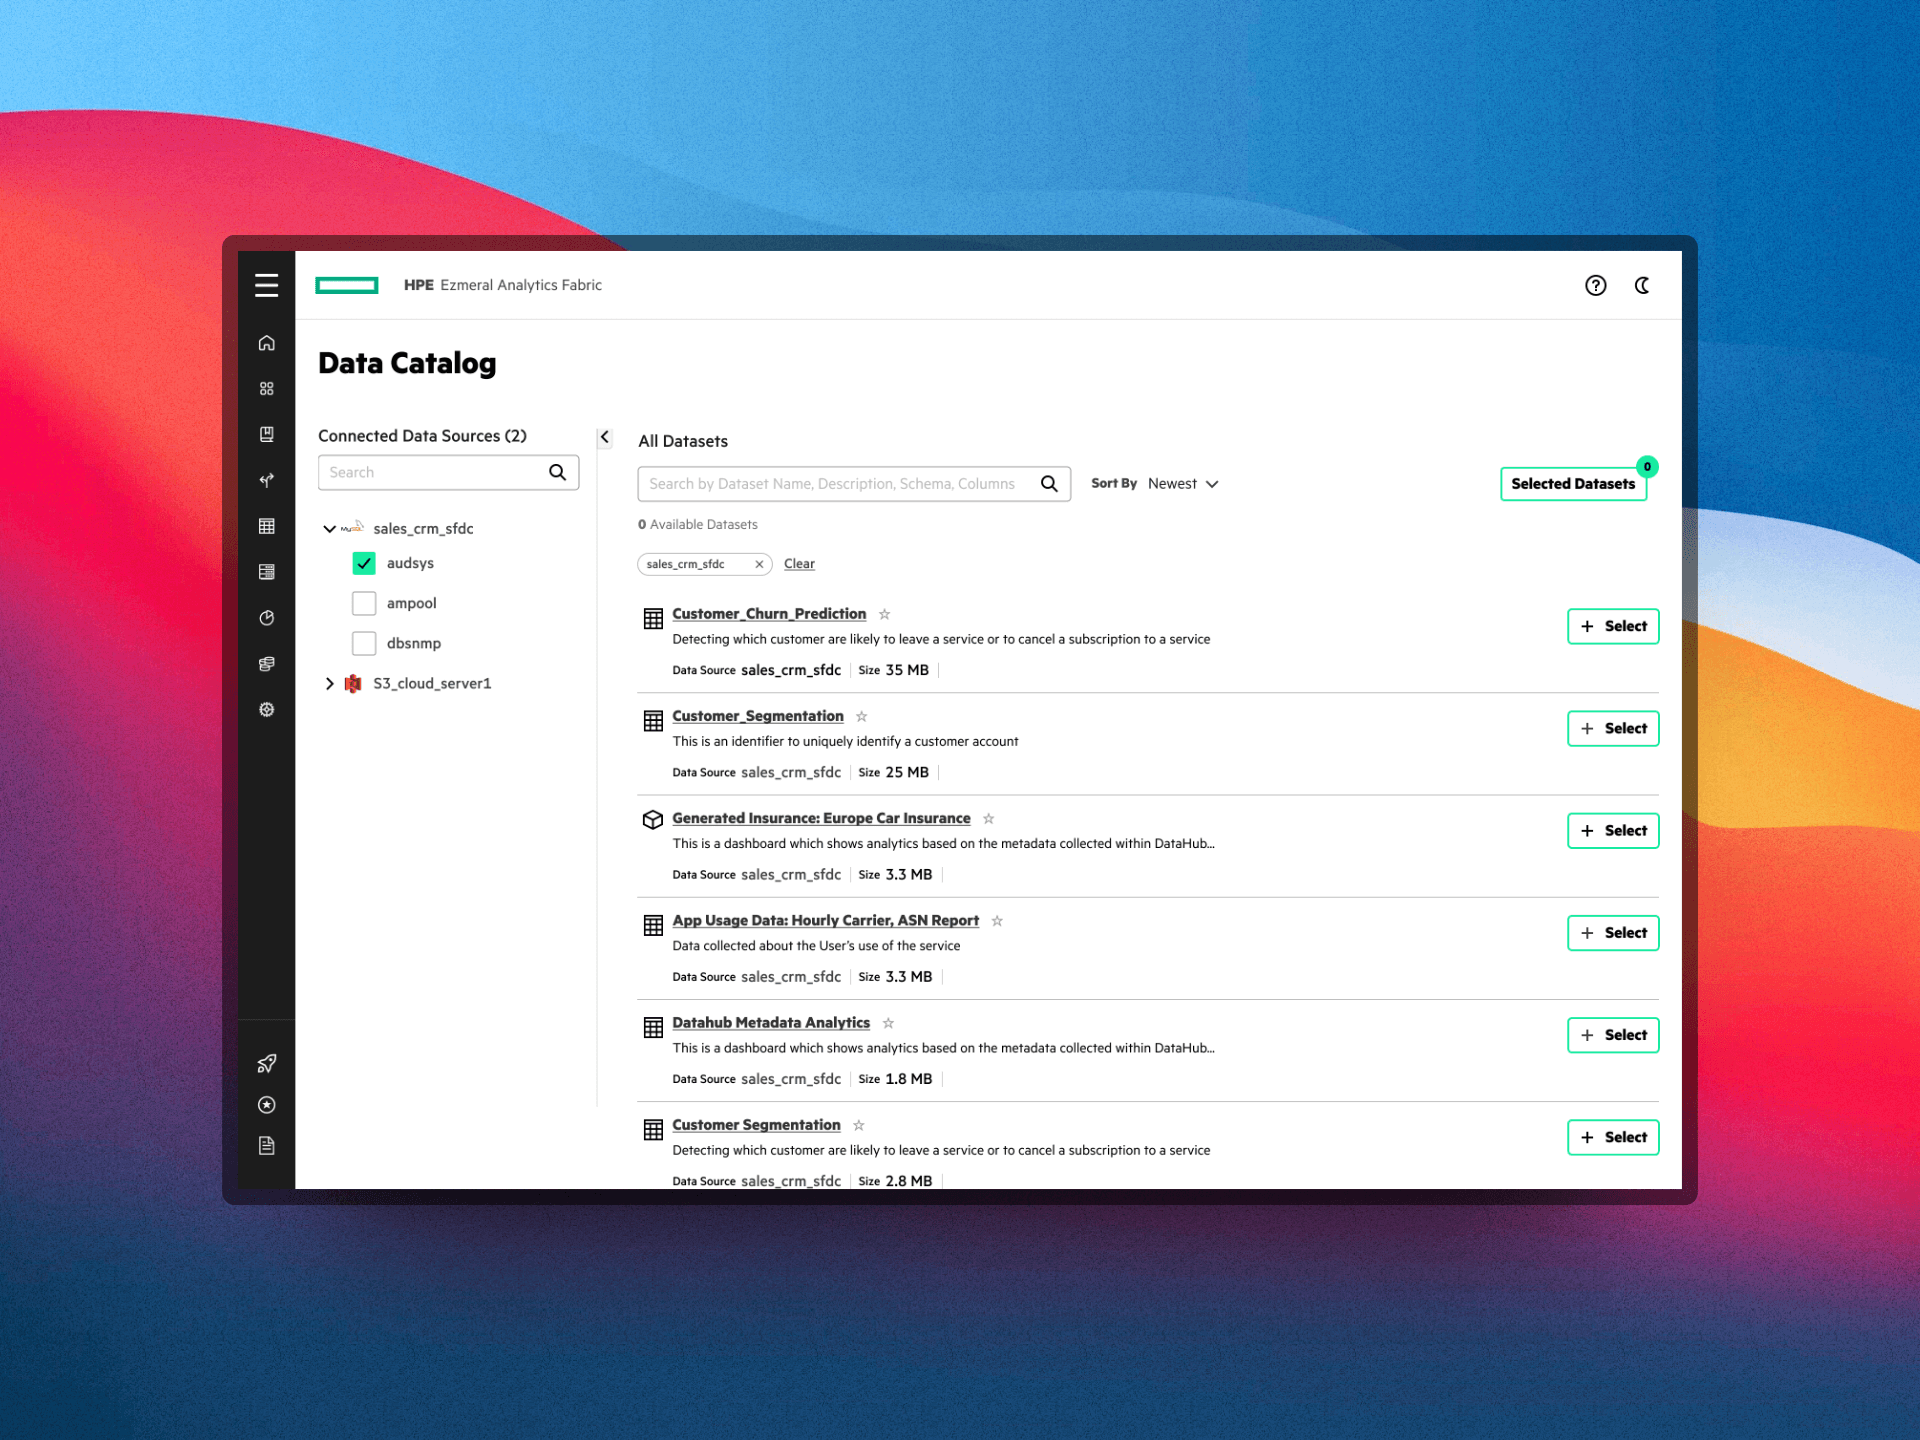

What I shipped..

I designed the solution which is a unified data administration tool for our target personas. Focusing on data engineers as a persona alone, I designed and shipped the workflow for their tasks i.e ingesting data from various sources into our platform to clean and transform for the other personas.

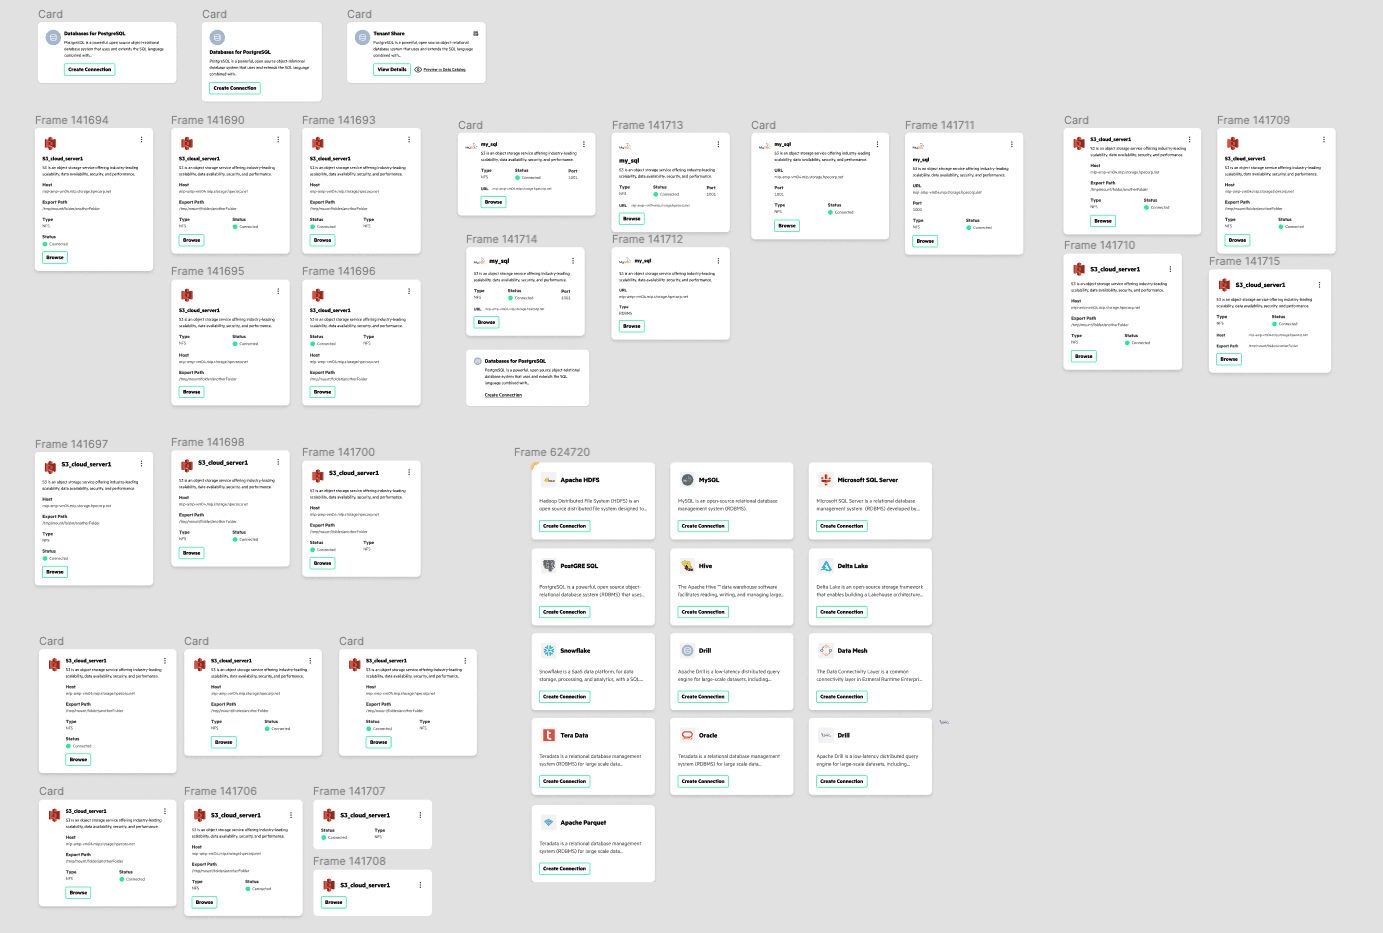
Some screenshots of the high-fidelity mockups

The Process

We were building a consumer-grade experience for enterprise users. I followed a collaborative, data-driven, and decision-heavy process involving various teams to create a unified hybrid data product. I relied on research data and collaboration to iterate on complexities and problems. I presented all findings to key stakeholders, and each phase informed the next phase of the design process.

Strategize

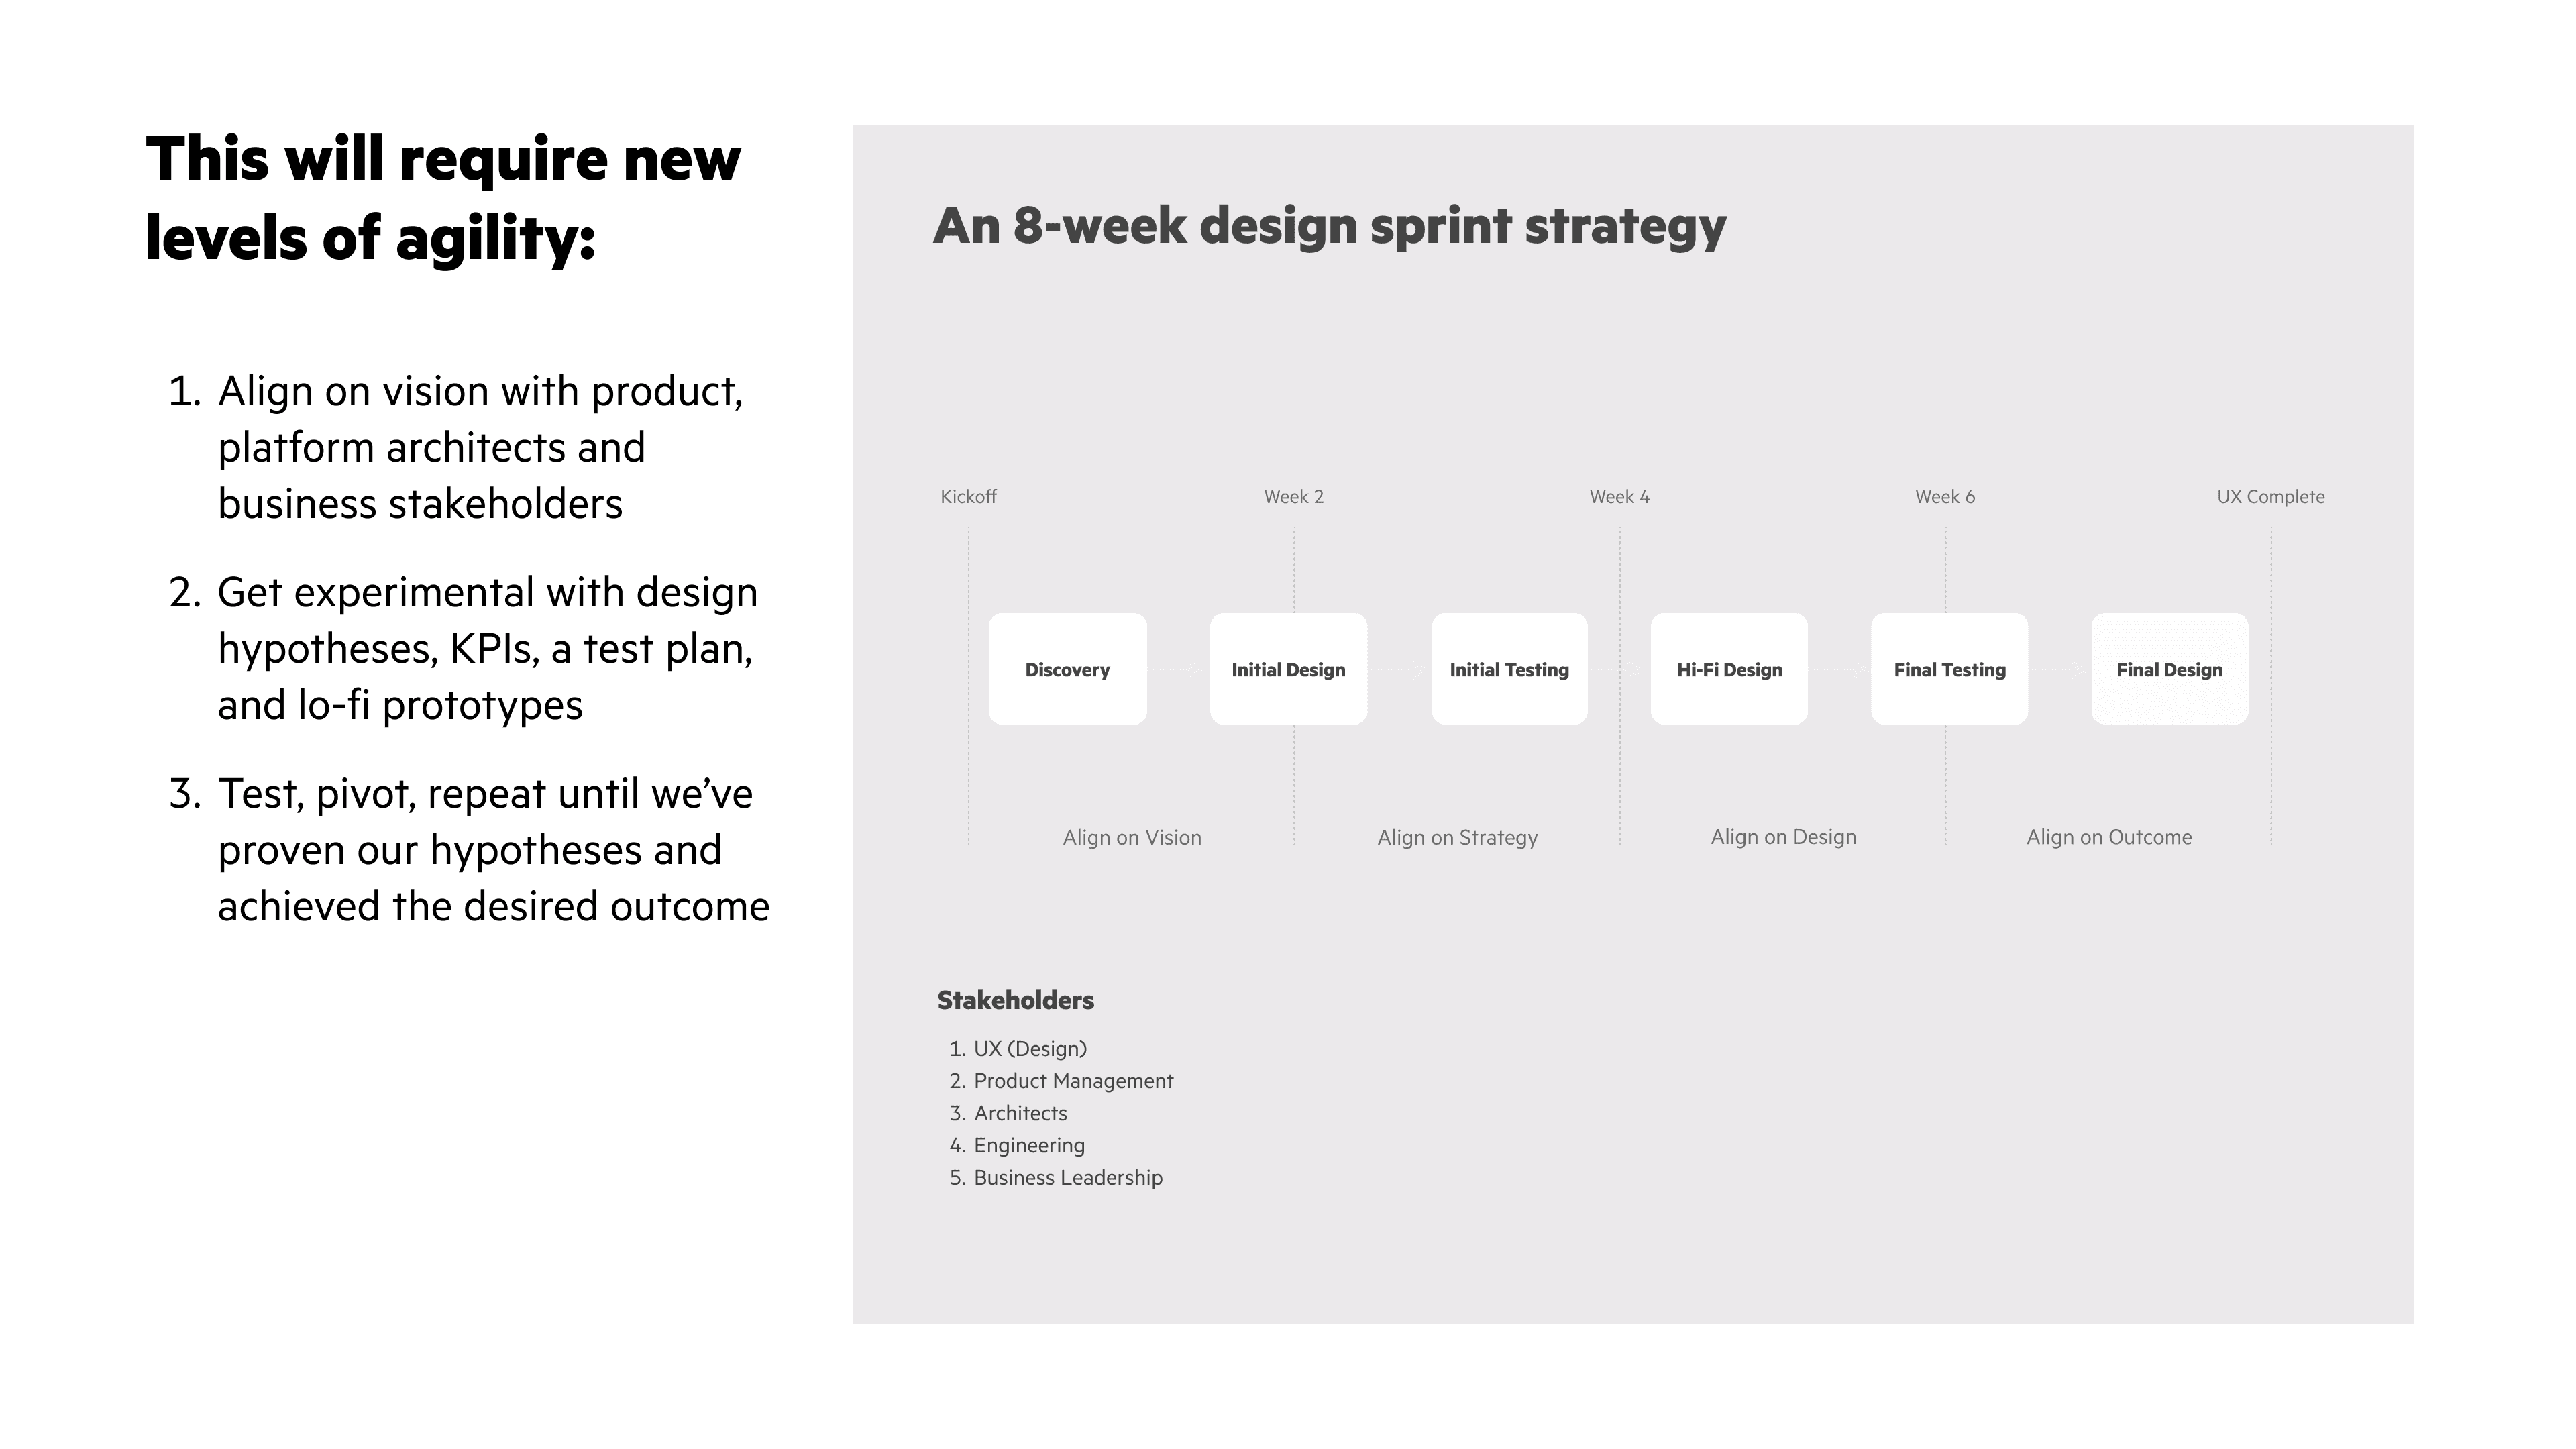
"Handling feedback was a particularly difficult task and seemed like a constantly shifting balance of divergent perspectives"

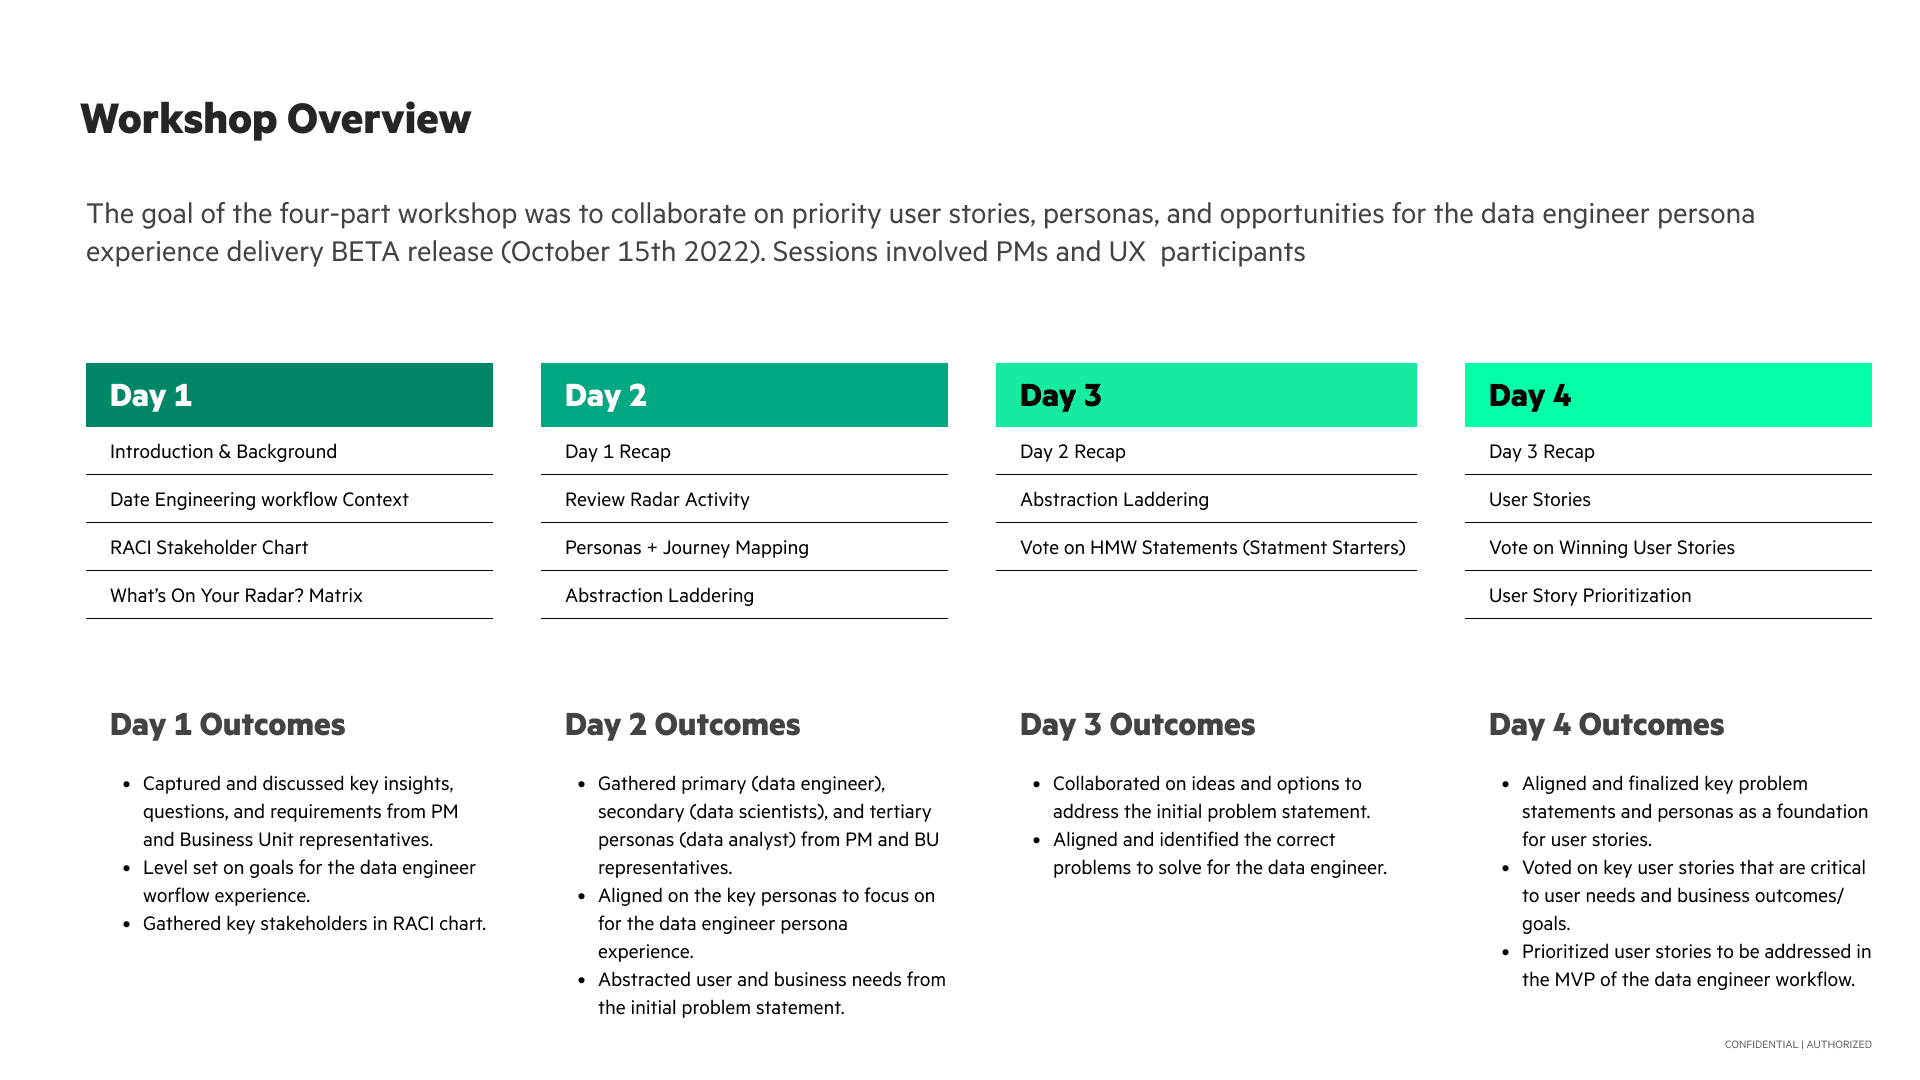
To tackle this, I relied on the data and used design principles to inform decisions. From my research, I created user stories based on pain points in the industry such as performance time and data dispersion. These stories served as the basis for project planning, estimation, design, and development work. I led the creation of personas, a user journey, and information architecture.

High level user journey map of a data engineer

Design principles

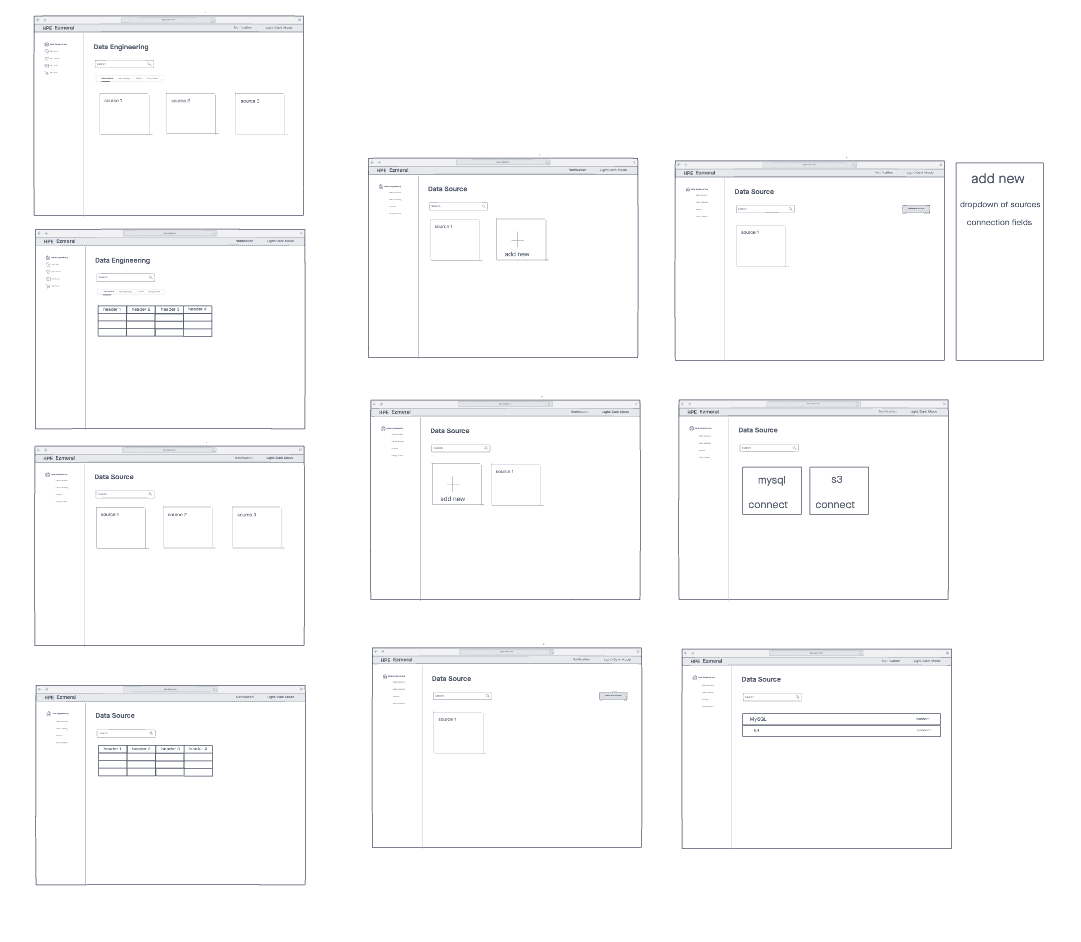
Before designing, I set success metrics and design principles that tied back to the business goal of increasing NPS score and customer adoption. I designed low and high-fidelity mockups in Figma and accounted for internal stakeholder feedback to refine the solution. During the design process, I considered design rationales such as why cards were better than traditional tables.

1

Implement Plain Language

Focus on use of Plain Language for clear and concise writing to increase usability

2

Increase Readability & Efficiency

Focus more on readability, findability, and quick-to-perform actions where demanded

3

Ensure Intuitiveness & consistency

Focus more on readability, findability, and quick-to-perform actions where demanded

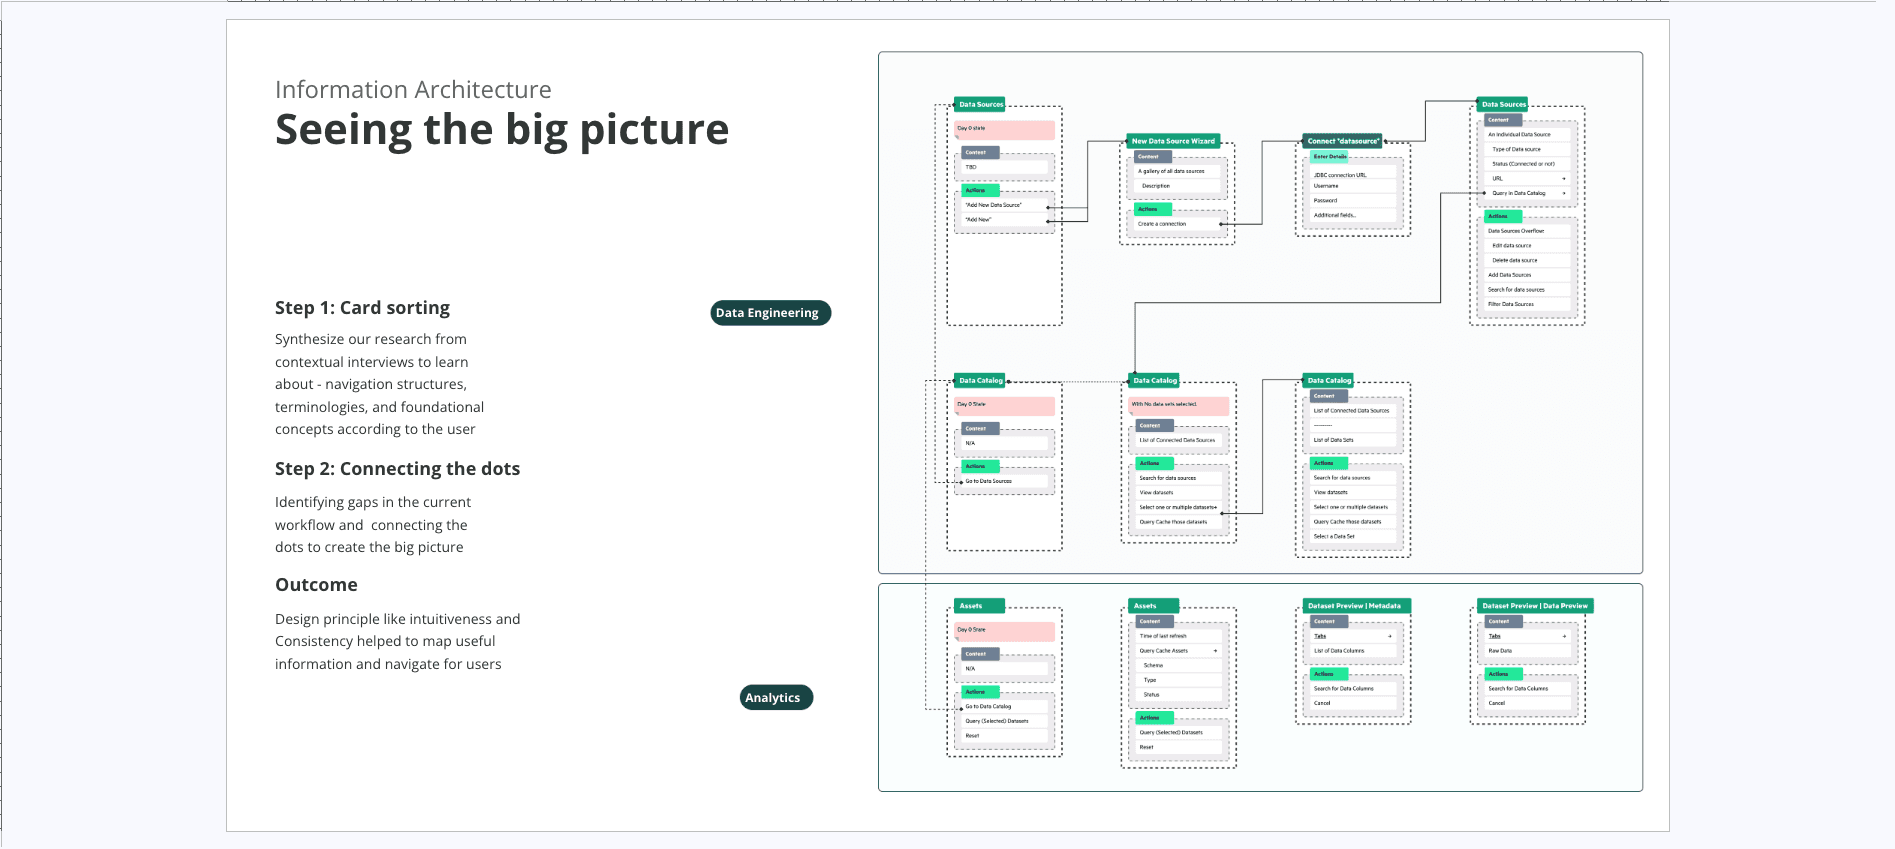
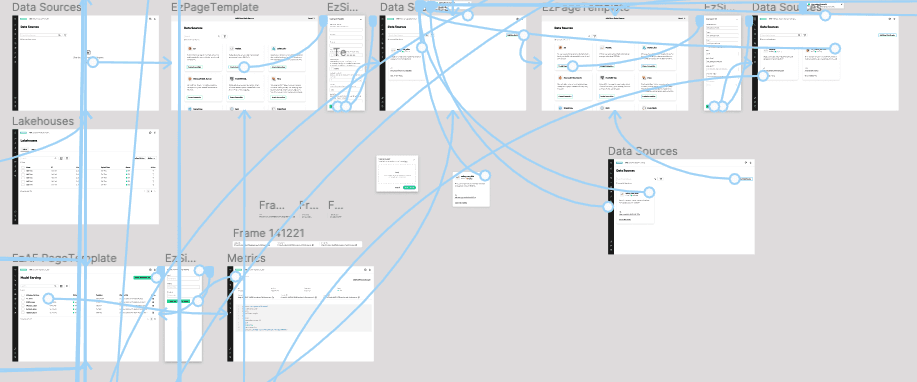
High level information architecture

"I considered prototyping as the most effective means of receiving substantial feedback"

Iterations

Usability Testing

I conducted usability testing with 20+ participants, resulting in an 96% task completion rate, 84 SUS score, and 3.5 min time on task, compared to 15 mins for competitors. I involved every key stakeholder in my design process beforehand to create a smoother design hand-off.

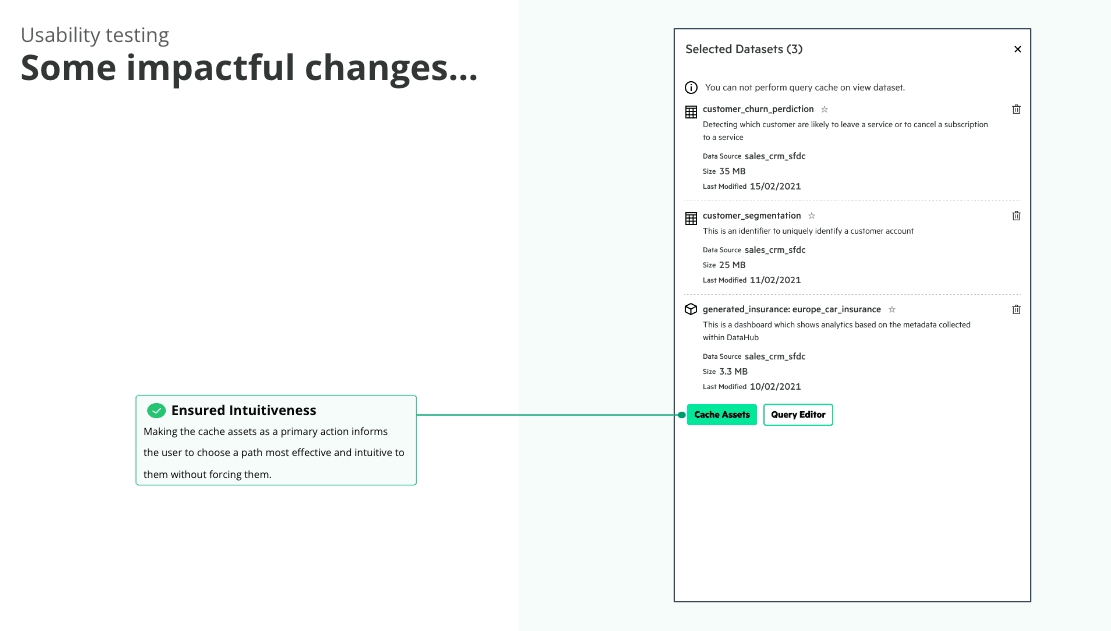
Example of user testing results with a data engineer
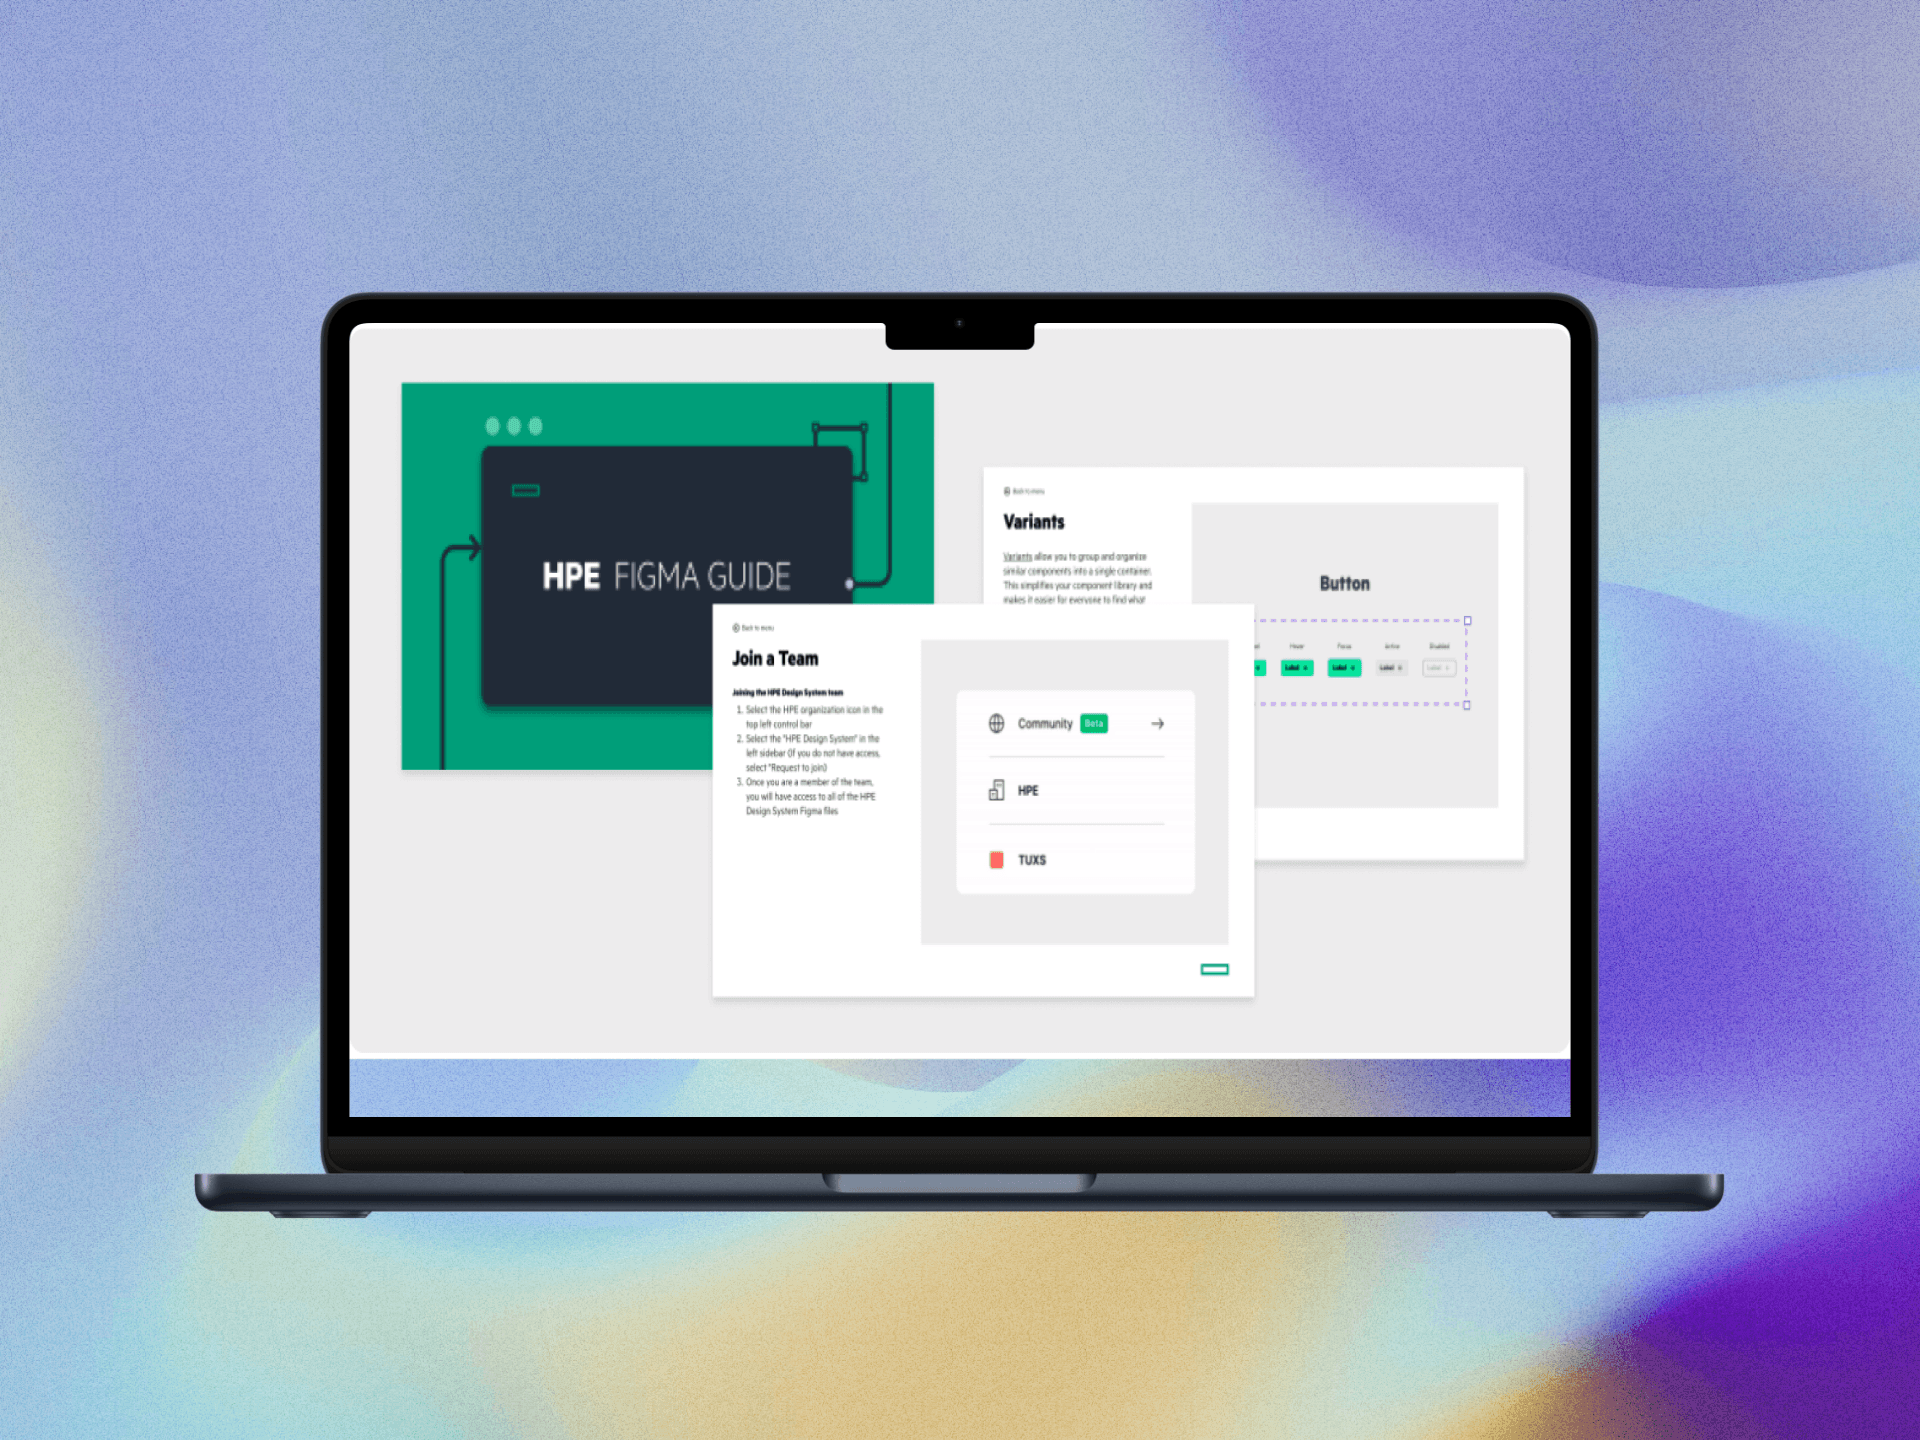
The Design System

I discovered a need for a card component in the HPE Design System while working on the Unified Analytics product. After investigating, I found no specific component for it, and designers were detaching existing components and seeking help without proper guidance or documentation. The HPE Design System was still maturing at that time which led to my contribution of the card component.

To address this, I collaborated with other designers, developers, and product owners to research use cases and analyze other design systems. I defined the needs, guidelines, variants, accessibility, and responsiveness with an eye for detail.

As a full-stack designer with a technical background, I tested the components with designers and handed off my work to the developers. Later on, I worked with developers as well to look at how things are in the code base. The card component I created increased productivity and efficiency for designers, engineers, and product managers, reducing 20 hours of work per month per employee. It increased end-user adoption by 10% and user retention for over 300k customers across multiple products, while also improving the designer-developer handoff by eliminating broken design tokens and documentation. I will be going into detail on this in a separate section.

The Impact

I successfully shipped the designs for the BETA release on October 15th, 2022, and the General Availability release on May 2nd, 2023. EzSQL workflow is responsible for increasing the productivity of data engineers in enterprises by decreasing the performance time and data dispersion. We are predicting improvement in the product metrics bringing the NPS score to 8 and the adoption rate to 25% in turn creating new business opportunities worth 30M+. Currently, we are doing post-launch product analytics to refine based on the feedback of customers. One area that we are focusing on is navigation and refactoring the information architecture for it.